
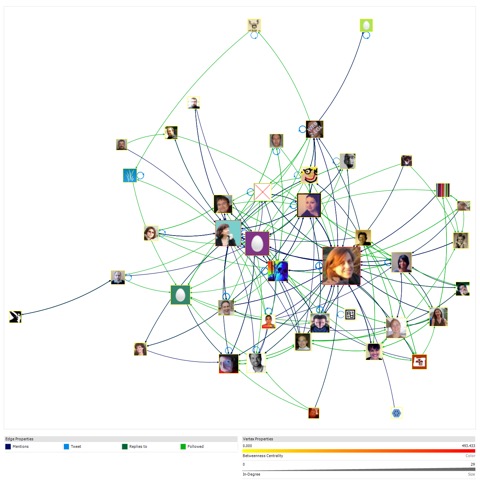
The users with the highest betweenness centrality in the network are:
@palen: 493.433
@gabig58: 403.996
@professorbodker: 138.662
@stuaart: 138.095
@luiciolfi: 83.279
@tspiliot: 78.000
@aarongenest: 67.371
@sct_r: 49.507
@ecscw2011: 36.969
@kenbod: 26.175
Overall network metrics:
Vertices 42
Unique Edges 162
Edges With Duplicates 574
Total Edges 736
Self-Loops 368
Connected Components 2
Single-Vertex Connected Components 1
Maximum Vertices in a Connected Component 41
Maximum Edges in a Connected Component 735
Maximum Geodesic Distance (Diameter) 4
Average Geodesic Distance 1.997622
Graph Density 0.130662021